Category: Digging into Data

Trading Consequences’ First Year

Co-Authored with Beatrice Alex

Trading Consequences is a Digging Into Data funded collaboration between commodity historians, computational linguists, computer scientists and librarians. We have been working for a year to develop a system that will text mine more than two million pages of digitized historical documents to extract relevant information about the nineteenth-century commodity trade. We are particularly interested in identifying some new environmental consequences of the growing quantity of natural resources imported into Britain during the century.

During our first year we’ve gathered the digitized text data from a number of vendors, honed our key historical questions, created a list of more than four hundred commodities imported into Britain, and developed an early working prototype. In the process we’ve learned a lot about each others’ disciplines, making it increasingly possible for historians, computational linguists, and visualization experts to discuss and solve research challenges.

Our initial prototype has limited functionality and focuses on a smaller same of our corpus of documents. In the months ahead it will then become increasingly powerful and populated with more and more data. Late last year, we completed the first prototype. Here’s a picture of the overall architecture:

GIS and Time

[This is my first post for The Otter since I passed on the editorial duties to Josh MacFadyen in the summer]

One of the major weaknesses in using GIS for historical research are the limitations in showing change over time. GIS was designed with geography in mind and until recently historians needed to adapt the technology to meet our needs. Generally this meant creating a series of maps to show change overtime or as Dan MacFarlane did last week, include labels identifying how different layers represent different time periods. More recently, ArcGIS and Quantum GIS introduced features to recognize a time field in data and make it possible to include a time-line slider bar or animate the time series data in a video.


UK Tallow Imports, 1865-1904 from Jim Clifford on Vimeo.

19th Century Changes in the British Tallow Supply

Tallow, fat rendered from sheep and cows, was a major ingredient in soap and candles. While large amounts of animal fats were collected locally from butchers and household waste, Britain imported between £500,000 to £2,500,000 worth of tallow a year between the 1870s and 1890s. This equaled more than twenty-one thousand tons a year in the mid-1780s, increasing to over forty thousand tons in the late 1860s and surpassing a hundred thousand tons a year in the late 1890s.

During the late 18th century the vast majority of the tallow came from Russia. Based on the limited sources I’ve found so far, it appears that some of this tallow originated as sheep grazing on the Kazakh Steppe on the eastern edge of the Russian Empire, while the rest of it was a by-product of Russia’s domestic livestock market. These sheep were rendered near Orenburg and then the tallow traveled vast distances overland to Arkhangelsk, before it was shipped to Britain. I would love to learn about more sources to better understand the Russian side of this trade.

British Tallow Imports 1784-1786 (Total imports: £517,000)

The Russians remained dominant through to the mid-19th century. During the second half of the 19th century the Russian trade collapsed and was replaced by the United States, South America and Australasia. I am still looking into the causes of this dramatic shift, but in general it demonstrates the instability brought on by the globalization of this industrial supply chain. The other factor missing from these maps is the increased importance of palm and coconut oil in soap and candle making. (The maps represent the percentage of the total value of imports from each region.)

Python and the Natural Language Toolkit

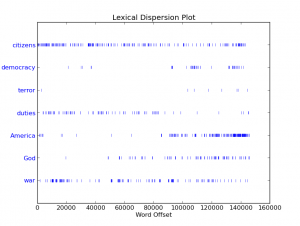
A graph showing the use of different words in a corpus of the U.S. Presidential Inaugural Addresses.

Since the end of the academic year, I’ve been able to focus a lot more attention on my post-doc research. This included a research trip in London archives and a week long course on databases at the Digital Humanities Institute in Victoria. Now I’ve started focusing on learning a programing language called Python. In the short-term, I don’t need to learn advanced computer skills for the Trading Consequences, as we have a team of highly skilled computer and linguistic experts. However, I do need a basic understanding of what we are actually doing when we text mine historical documents and looking forward to the end of the grant, I would like to be able to continued to work with the database. I would also like to develop the skills to continue this kind of research on my own in the future.

I always intended to start with the Programming Historian, but the new version will not come out for another few weeks, so instead, I began working through Learning Python the Hard Way over a few days in May. This was interesting, but solely focused on teaching programing and not particularly connected to the kind of research I would like to do. A few days ago I took a closer look at Natural Language Processing with Python, written by Steven Bird, Edward Loper and one of Trading Consequences team members, Ewan Klein. Reading the preface, it became clear the book was accessible people with no background in programming. The early chapters included both an introduction to computational linguistics and Python.

History vs. Geography and Sourcemap.com

First published on ActiveHistory.ca

The interactive map above, produced by Leo Bonanni, the CEO of Sourcemap.com, demonstrates the impressive power of geographical analysis in the early 21st century. The map shows the supply chains for a typical laptop computer and provides a fascinating insight into the complicated mix of natural resources and manufacturing labour needed. It raises questions about the environmental and social consequences of the computers that many of us interact with daily.

To what extent has geography emerged as a more powerful tool than history to shed light on the social and environmental consequences of today’s global economic and political systems?

West Ham 19th Century Industry Source Map

I am working on a paper for the American Society of Environmental History conference in Madison at the end of this month. The paper examines the global supply chains that fed factories in West Ham with raw materials throughout the nineteenth century. This included sugarcane for the Tate refinery, cinchona bark for making quinine, an antimalarial drug, at Howard & Sons, gutta-percha for making underwater telegraph cables in Silvertown, palm-oil and pot ash for making soap at the numerous soap works in the area. These industries also relied on local and British suppliers for coal and rendered animal fat, among other things. I’ve started playing with a web service called Source Map to map the network of trade that supplied West Ham’s factories and some of the places the manufactured goods were then exported to in the British world. I’ve not been super precise with the locations of the various factories and commodity frontiers in this early draft. [The map above continues to update as I work on this project. It is getting more accurate and more detailed than when I wrote the post below.]

I’d like to thank Devon Elliott (@devonelliott) for answering my Twitter question looking for a software or web service to map this trading network and turning me on to Source Map.